Noosa AI assistant
Describe changes in plain English. Noosa resolves them into precise Designer actions, adding charts, binding data, and updating colours in one go.
Build, brand, and ship polished Power BI-aligned dashboards in a fraction of the time. With AI that understands your canvas, every report is a conversation away.
No credit card required · 7-day free trial · Cancel anytime

Getting Started
See the core workflow in a short walkthrough, then jump into Designer with a clearer sense of how the canvas, editing flow, and first draft process fit together.
Why Noosa
From first sketch to production-ready Power BI export, Noosa handles the design, the data wiring, and the busywork.
Describe changes in plain English. Noosa resolves them into precise Designer actions, adding charts, binding data, and updating colours in one go.
Every visual, slicer, and layout element maps directly to Power BI types. Export to .pbix with one click and reduce rework.
Embed Noosa's rendering engine directly in your product and serve branded, interactive dashboards without standing up extra BI infrastructure.
Define a palette once. Noosa propagates brand colours, fonts, and spacing across every visual on every page, instantly.
Bubble maps and filled maps for 54 countries, auto-detected from your data.
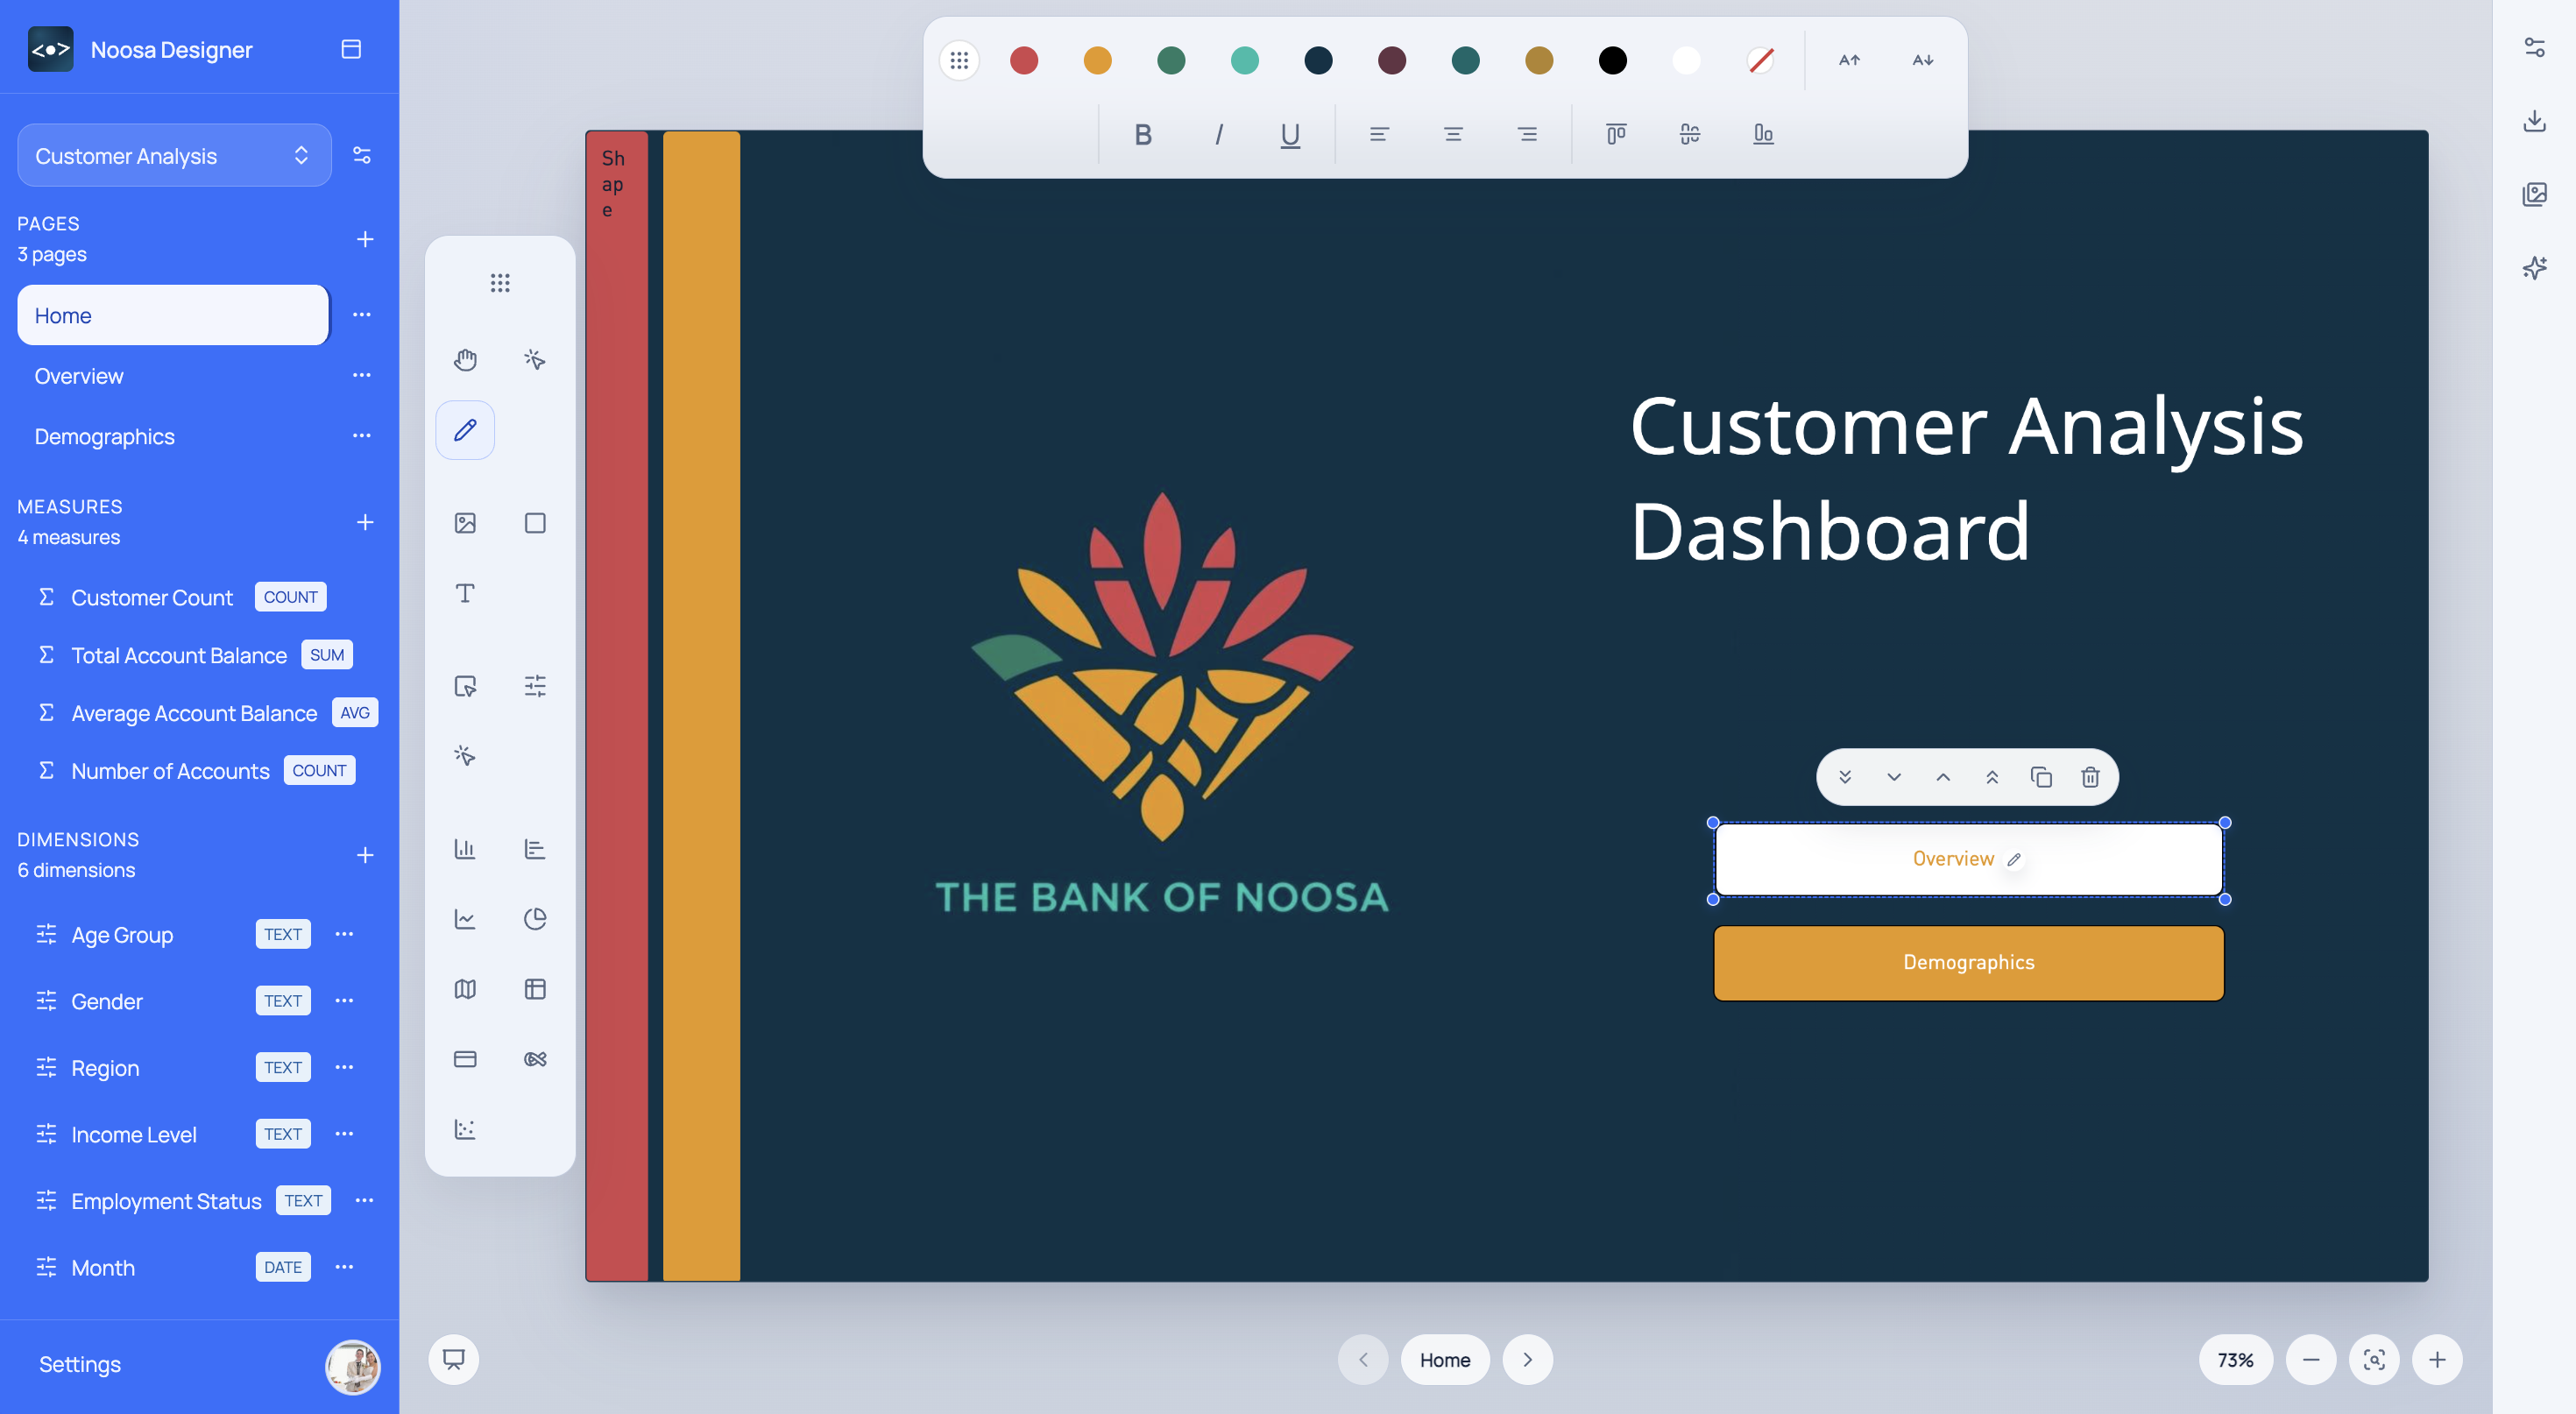
A canvas that feels like Figma and exports like Power BI. Resize, reorder, and group items with a precise grid.
Our Products
Whether you are designing internal dashboards or embedding analytics in a customer-facing product, there's a Noosa for that.
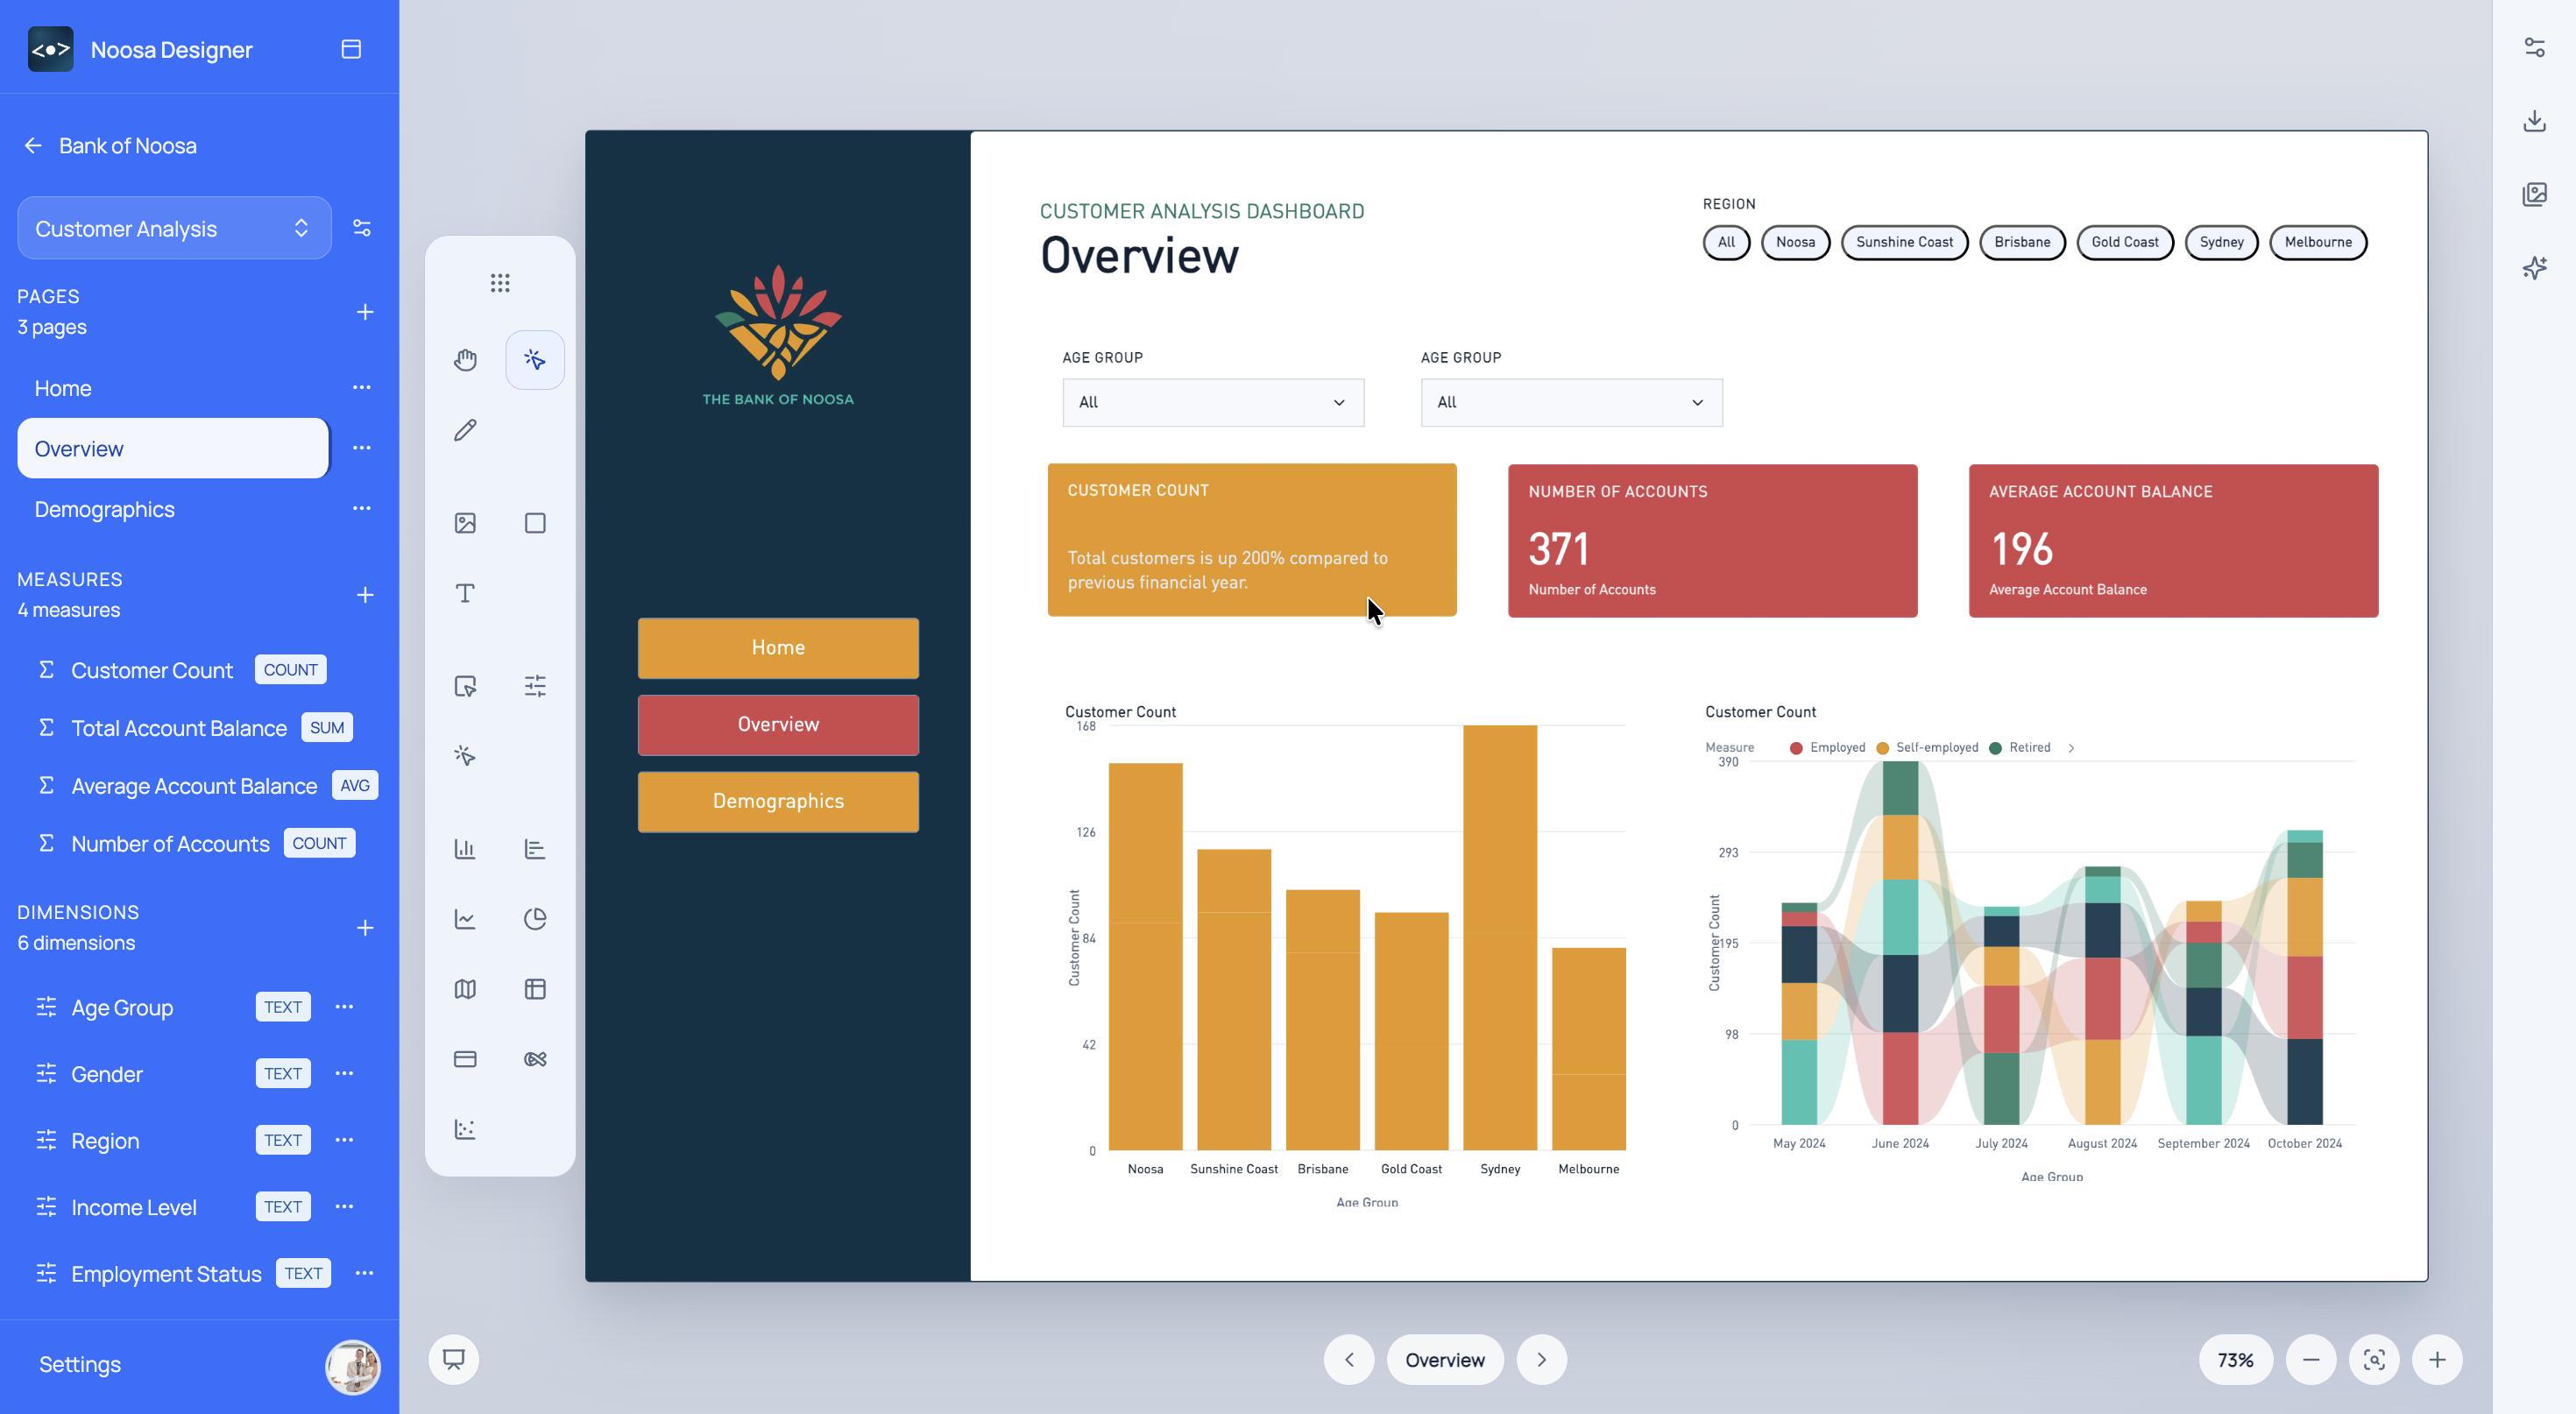
A web-based dashboard builder with an AI assistant, drag-and-drop canvas, and direct Power BI export. Build once, deploy anywhere.
Explore DesignerBrand-aware rendering and reusable BI components for embedded experiences.
Render branded, interactive BI components via a simple REST API. Integrate with any stack, including React, Vue, Angular, or plain HTML.
View API docsSolutions
Noosa adapts to how your organisation works, whether you are a solo analyst or a 200-person BI team.
From board packs to operational scorecards, Noosa helps your team deliver reports that drive real action, not just documentation.
Each industry template ships with pre-configured measures, dimensions, and layouts aligned to what your sector actually tracks.
Whether you are writing DAX or presenting to the board, Noosa meets you where you are.
Noosa AI
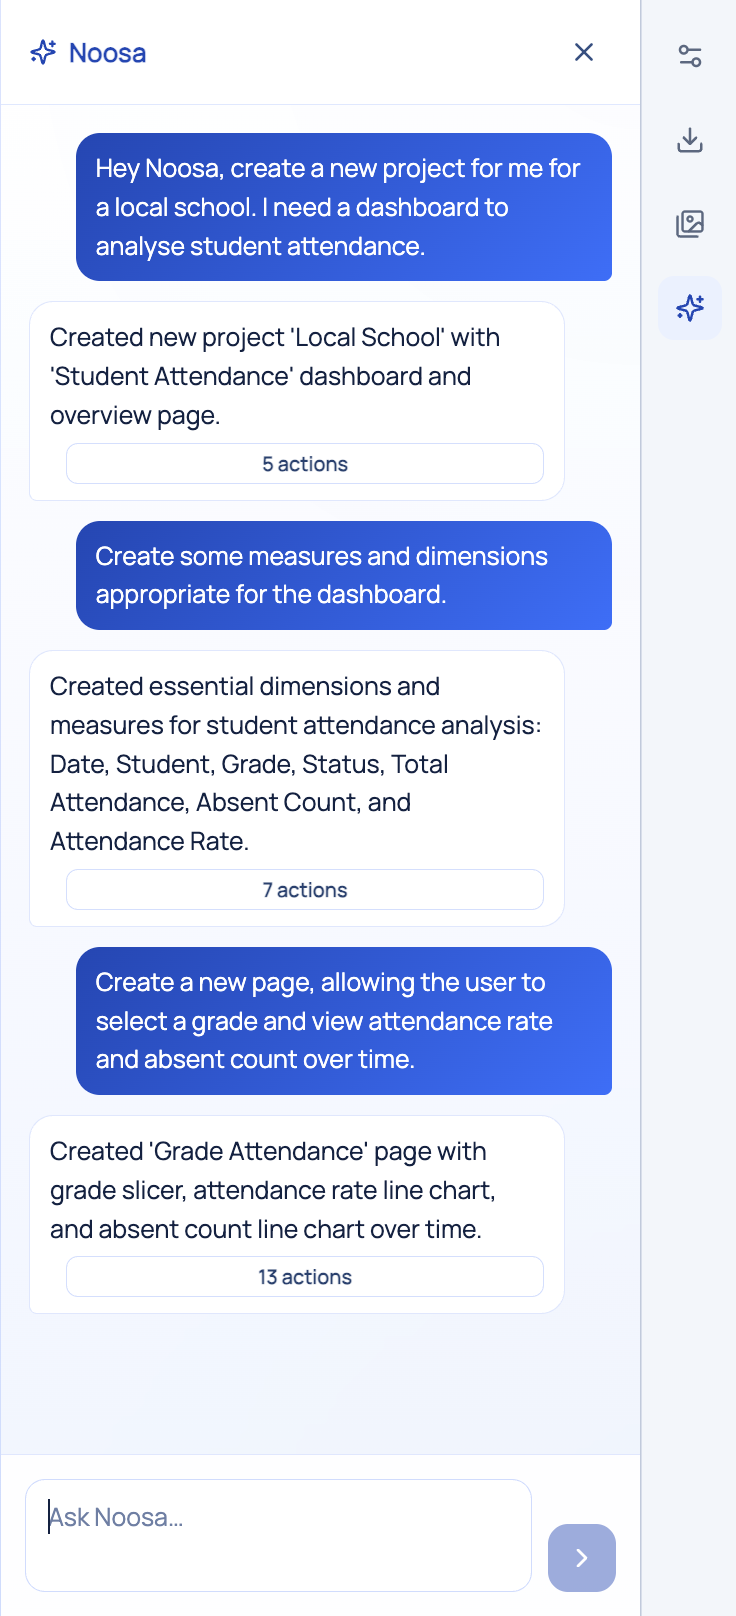
Noosa AI understands your canvas, what's on it, what's selected, and what you're trying to achieve. Ask it to build, rearrange, restyle, or bind data. It does the work.
Pricing
Start free. Upgrade when you're ready. No surprises.
Best for trying the workflow before you commit to a real production process.
For teams doing regular dashboard work with included usage credits and optional top-ups.
Secure long-term access early and participate closely as the platform value expands.
Resources
From quick-start guides to deep-dive tutorials, we've got you covered.
Watch the walkthrough, learn the first steps, and get oriented before building your first dashboard.
Watch Noosa build a full executive dashboard from a single prompt.
How to map Noosa visuals to Power BI types for a clean, no-rework export.
Embed your first branded chart in a React or plain-HTML app in under 10 minutes.
FAQ
A cleaner summary of how Noosa Designer, Noosa AI, and the BrandNoo API fit into prototyping, branding, and delivery.
Noosa Designer is the hands-on workspace for building Power BI-aligned dashboards, shaping layouts, and reviewing ideas with stakeholders. The BrandNoo API is the programmable layer for brand-aware rendering, colour systems, and reusable analytics presentation inside your own product or workflow.
Yes. The landing workflow is built around earlier prototyping, dummy data, KPI framing, and stakeholder sign-off so teams can agree on reporting direction before implementation gets locked in.
Noosa AI understands the current canvas and can turn a single prompt into multiple actions, like adding visuals, restyling a page, moving layout blocks, or preparing a more polished review state for the team.
You can submit a brand or URL and immediately inspect returned colours, logo findings, and styling context in a landing-style playground. It is meant to highlight the visual output first, with diagnostics still available when you need them.
No. Solo analysts, consultants, and smaller delivery teams can start with a single prototype or client concept, then expand into a repeatable workflow once the value is clear.
Start for free
Choose a sign-in method to open Designer.