Faster review cycles
<built-in method copy of dict object at 0x7fa1f0819a00>
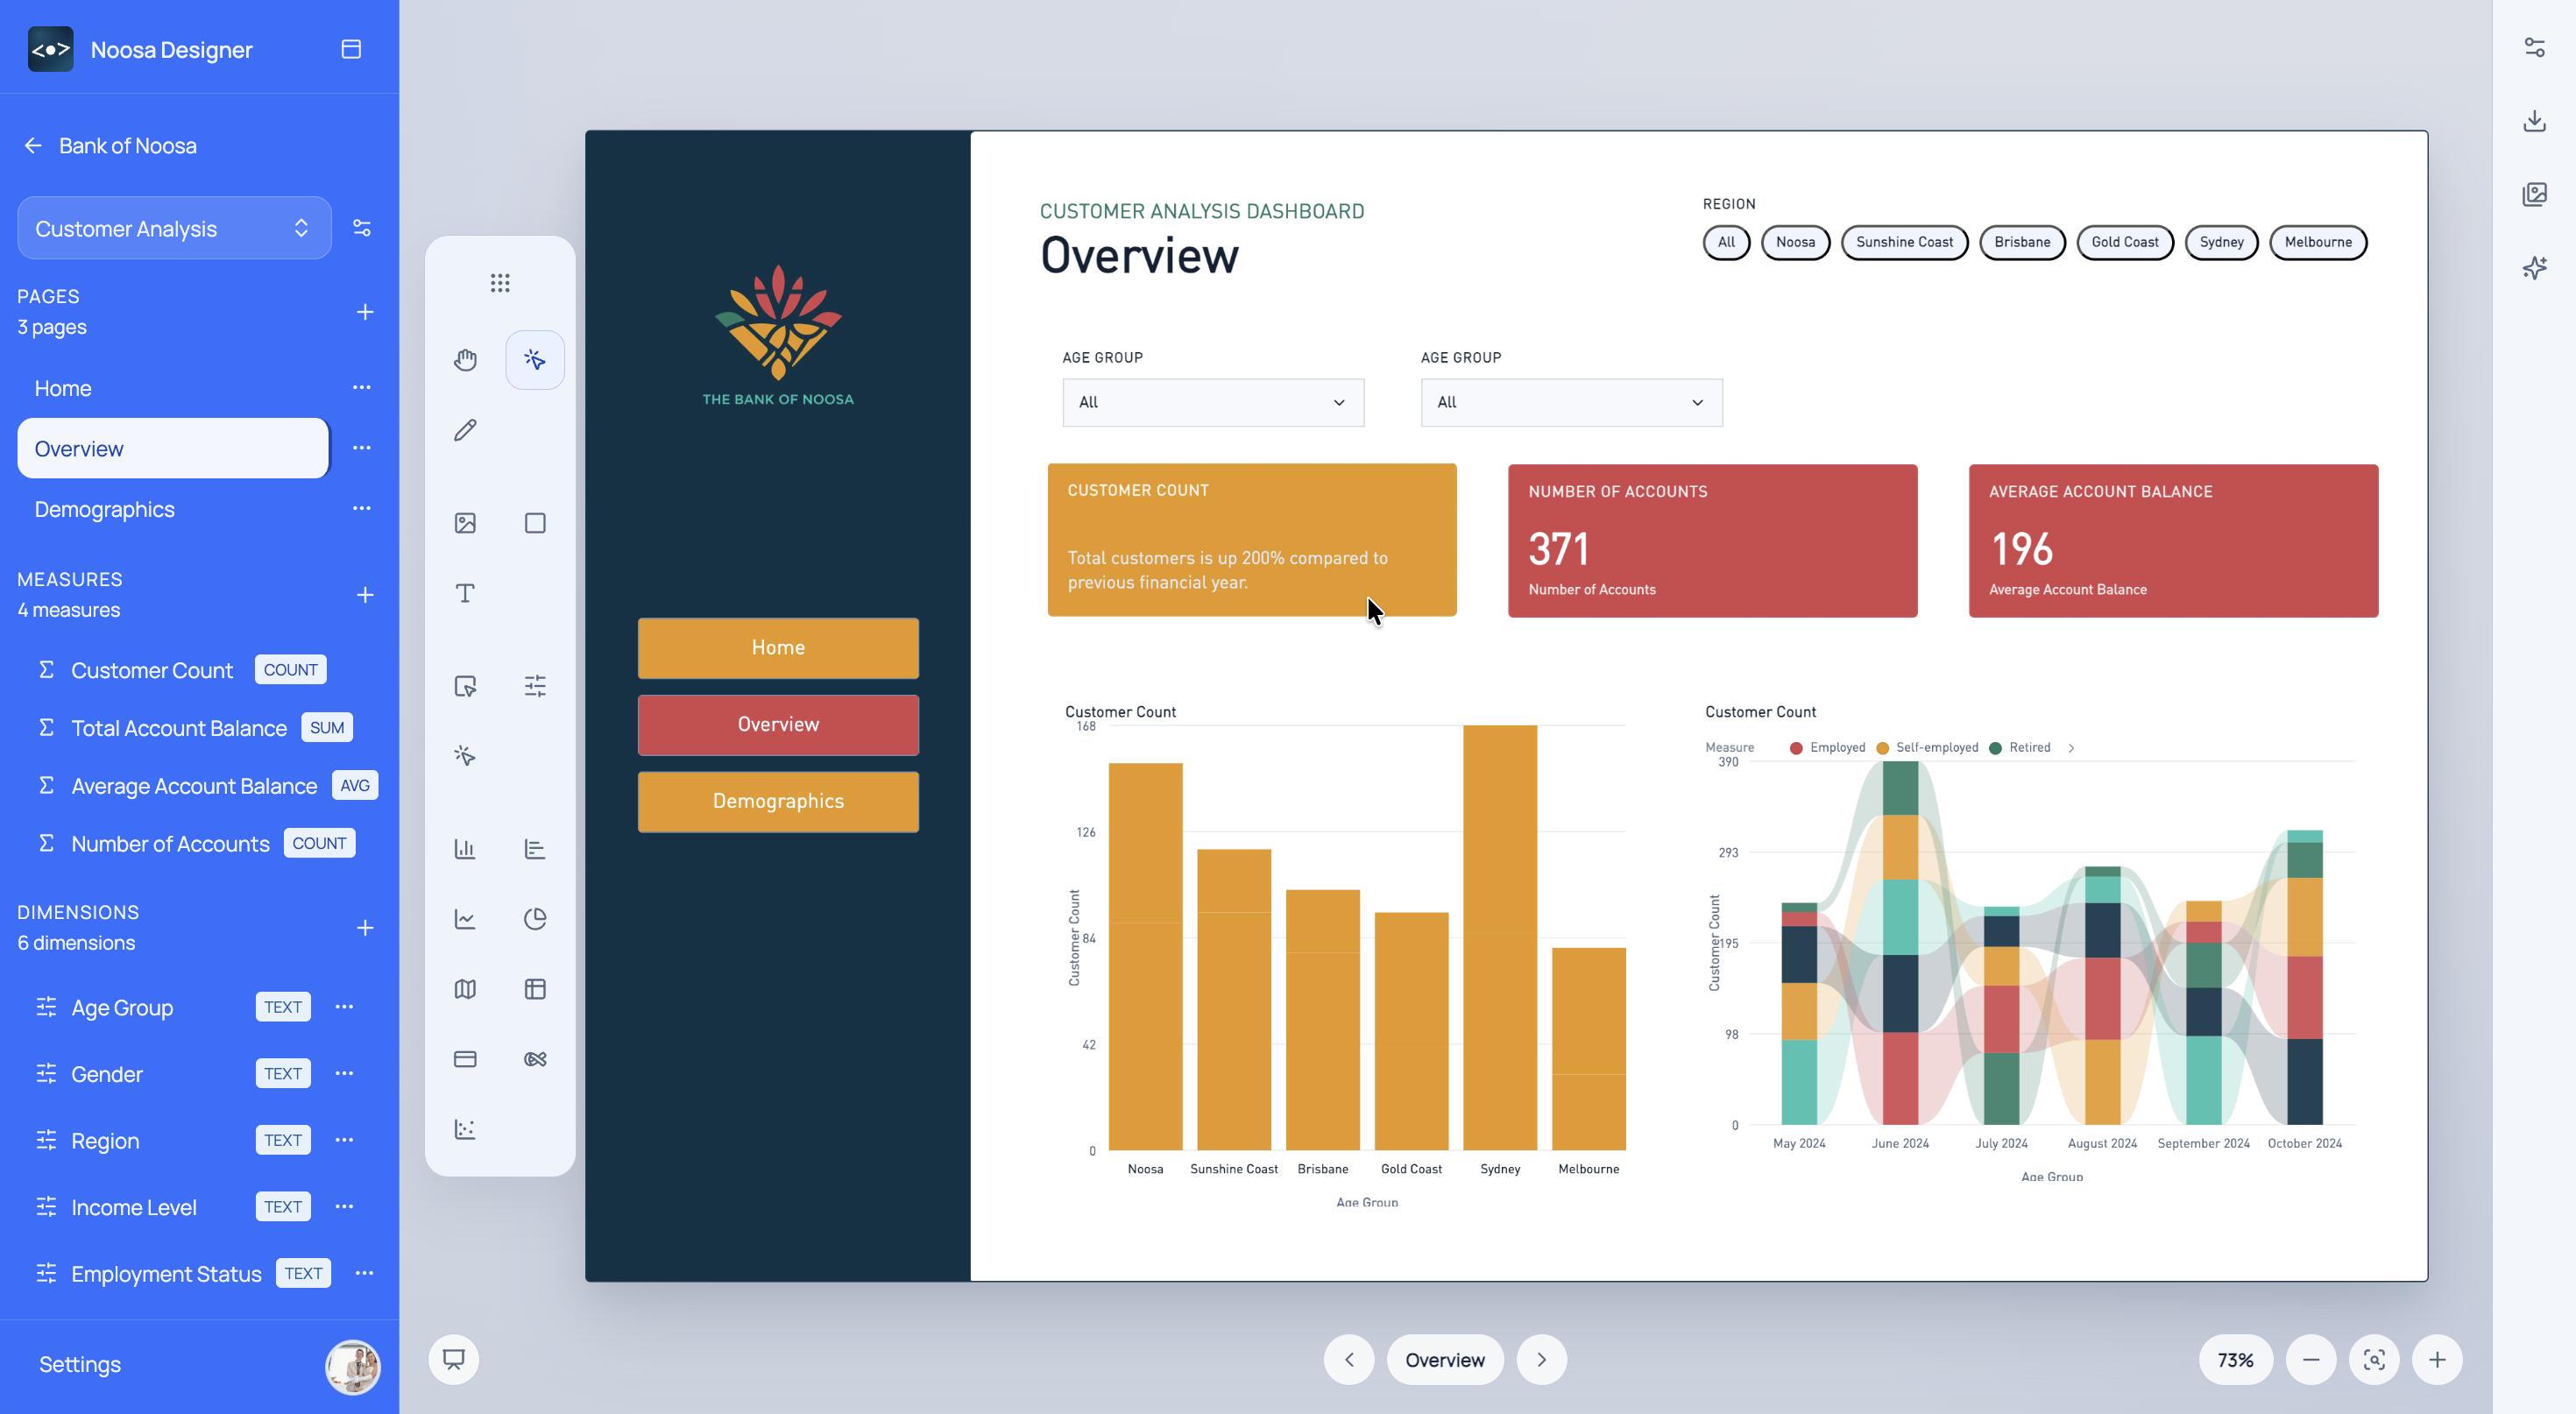
Use Case
Prototype dashboard direction before the build starts, so teams can align on layout, KPI story, and presentation quality earlier.
What This Helps With
This workflow is built for teams who need a strong prototype before time is spent wiring the final model and report logic.
<built-in method copy of dict object at 0x7fa1f0819a00>
<built-in method copy of dict object at 0x7fa1f082a980>
<built-in method copy of dict object at 0x7fa1f082bdc0>
Noosa AI Example
A team can describe the reporting story in plain English and let Noosa AI build out the first prototype quickly.
The team gets a credible first version of the dashboard story in minutes, ready for review and iteration.
Typical Workflow
<built-in method copy of dict object at 0x7fa1f07f3f80>
<built-in method copy of dict object at 0x7fa1f081a8c0>
<built-in method copy of dict object at 0x7fa1f0818a40>
Start for free
Choose a sign-in method to open Designer.