Practical KPI focus
<built-in method copy of dict object at 0x7fa1f0790f00>
Role
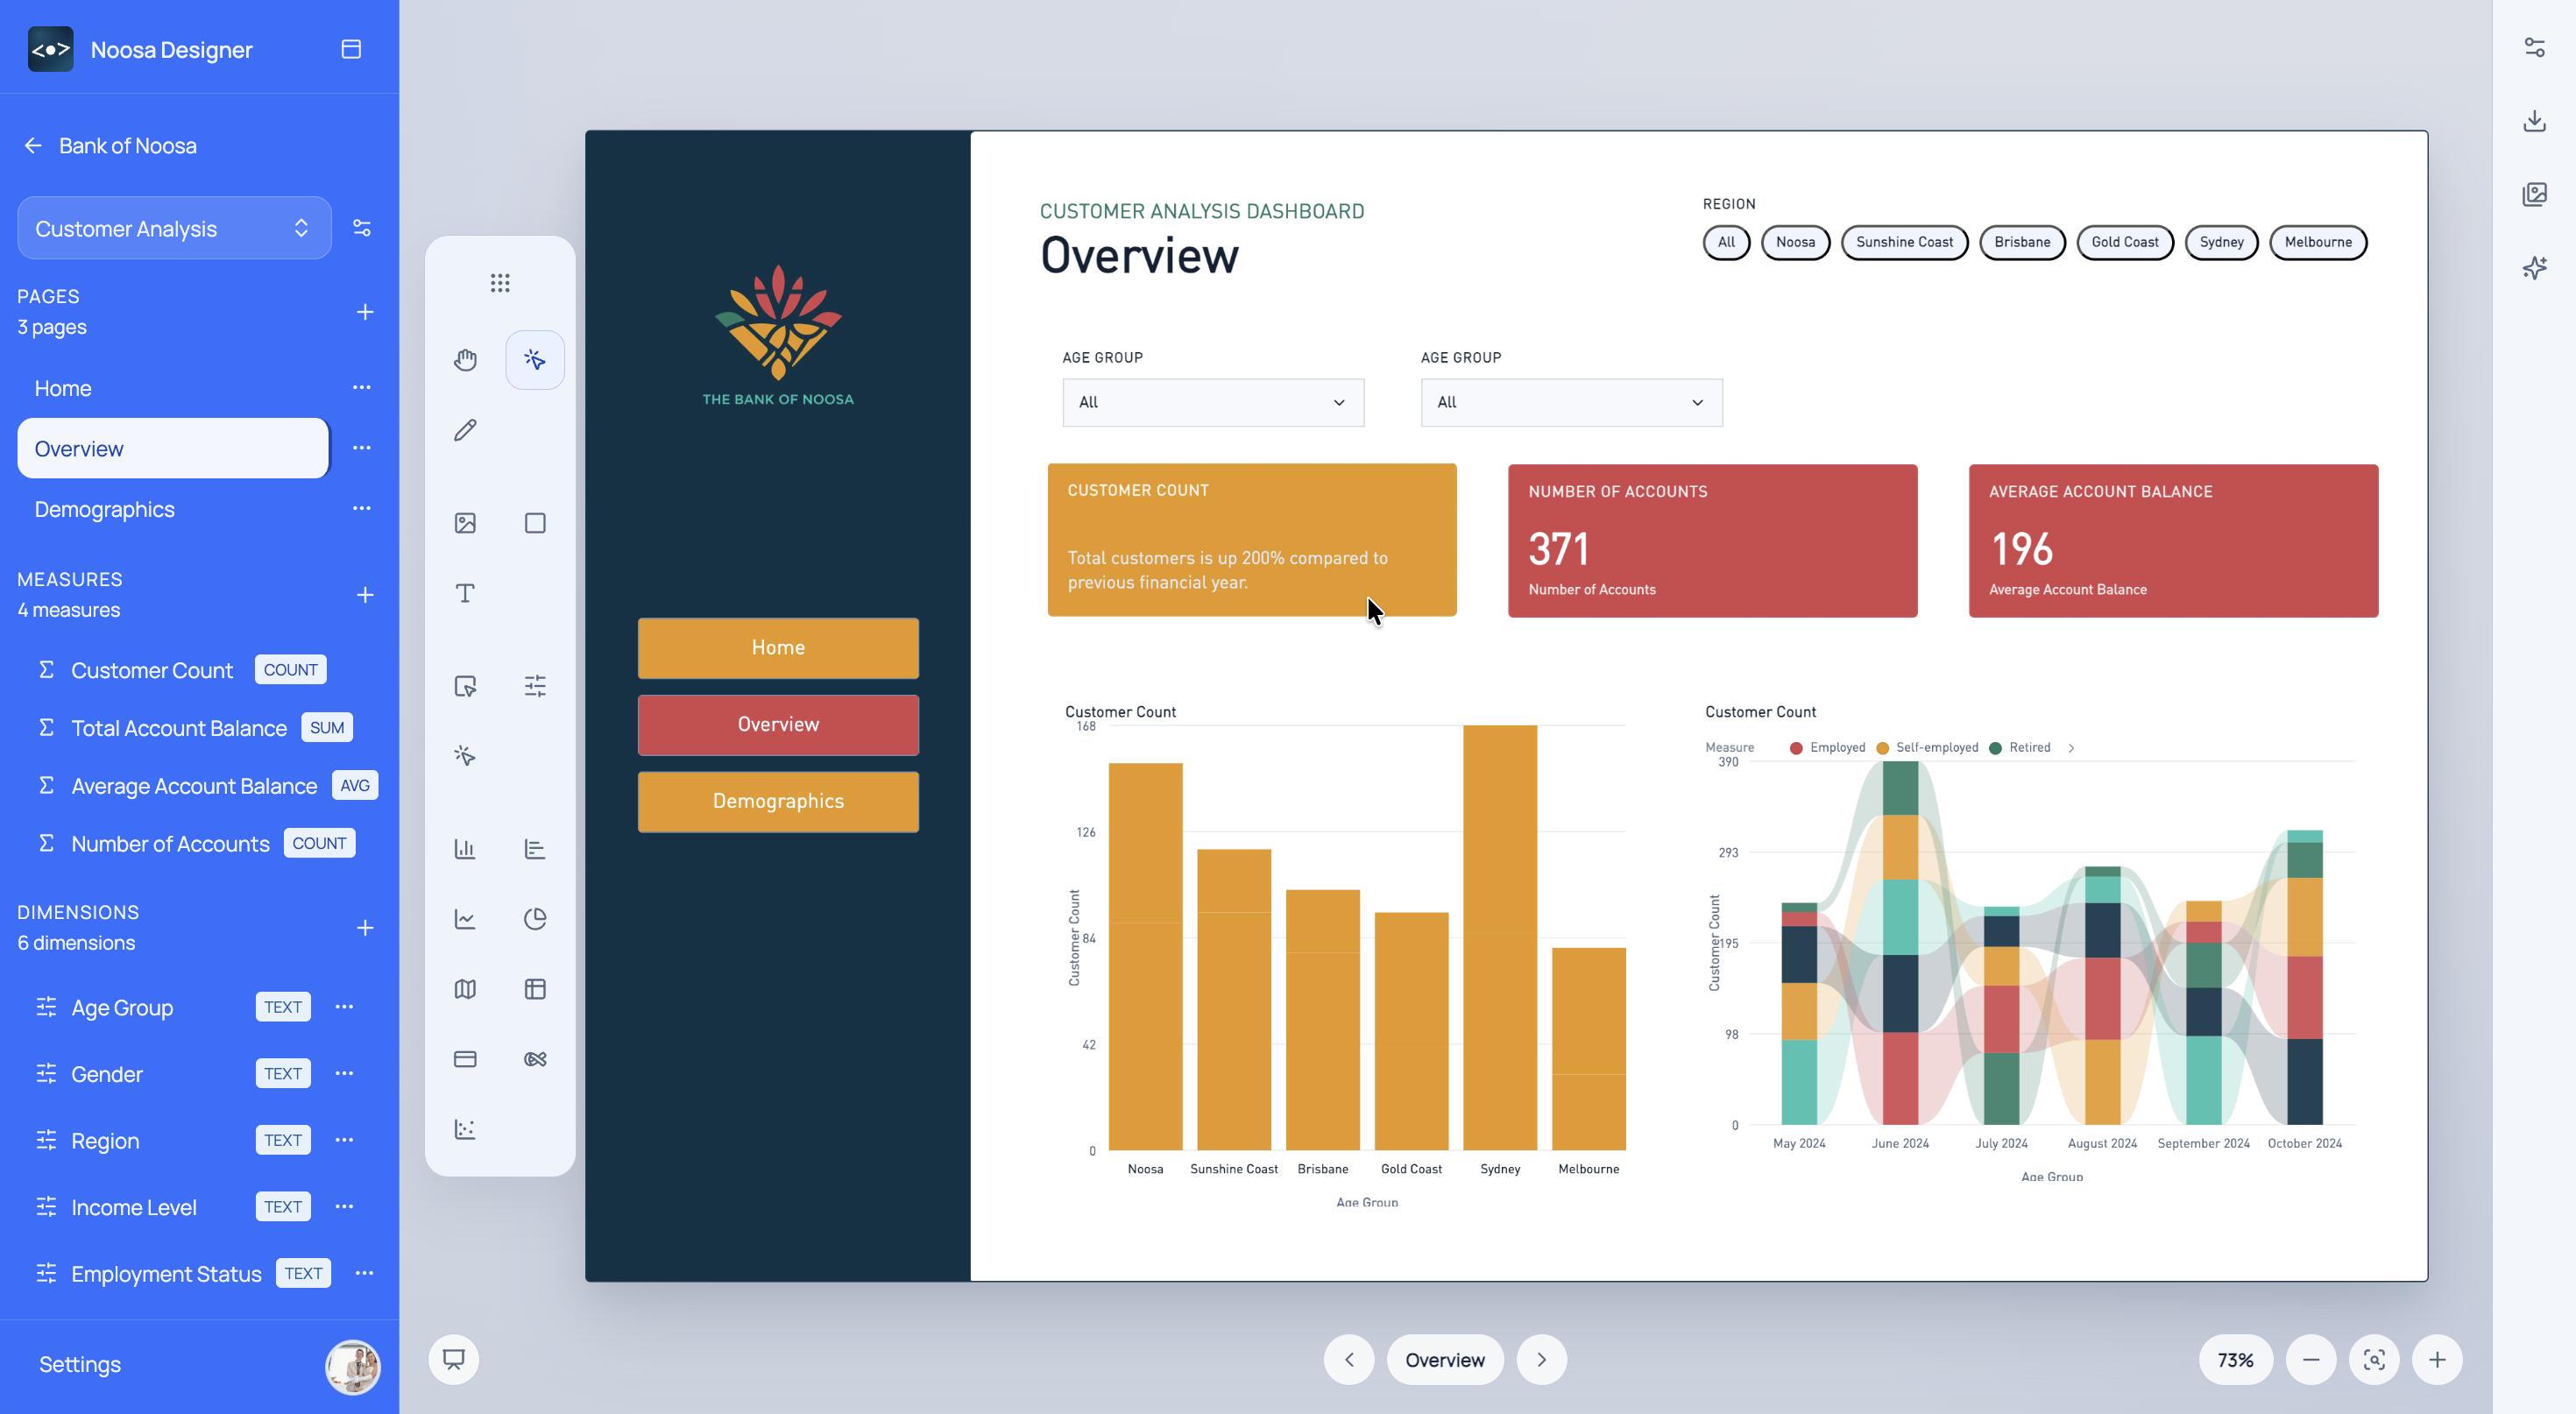
Use Noosa Designer to shape KPI dashboards around operational priorities and review them before implementation work starts.
What This Helps With
Operations teams need pages that support quick understanding, routine review, and practical action. Noosa helps design for that earlier.
<built-in method copy of dict object at 0x7fa1f0790f00>
<built-in method copy of dict object at 0x7fa1f07a9a40>
<built-in method copy of dict object at 0x7fa1f07c8f80>
Noosa AI Example
An operations manager can use Noosa AI to quickly turn performance questions into a workable dashboard page.
The team gets an operational dashboard concept that supports day-to-day decisions more clearly.
Typical Workflow
<built-in method copy of dict object at 0x7fa1f07ca380>
<built-in method copy of dict object at 0x7fa1f07f2fc0>
<built-in method copy of dict object at 0x7fa1f07f2d40>
Start for free
Choose a sign-in method to open Designer.